


Special Sensor Microwave/Imager (SSM/I) Rainfall Products
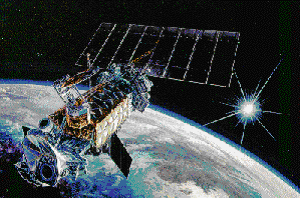 |
Sensor Description:
SSM/I was first launched on boad the Defense Meteorological Satellite Program (DMSP) F8 satellite in June of 1987. The DMSP series satellites are in sun-synchronous polar orbits at an altitude of approximately 830 km. The instrument is a seven channel linearly polarized passive microwave radiometer operating at frequencies of 19.36, 22.235, 37.0, and 85.5 GHz. Detailed specifications for the spacecraft and instrument are given by Hollinger et al. [1987] and Hollinger [1989, 1991].
Algorithm Version:
- GPR04 (GPROF Version 2004): The rainfall algorithm used to compute rainfall estimates from the SSM/I brightness temperature data is version 7 of the Goddard PROFiling algorithm (GPROF) [Kummerow et al., 2001]. Note that this version corresponds to version 6 of the GPROF algorithm applied to the TRMM TMI data.
- GPR04a (GPROF Version 2004a): The rain rates in version 2004a have been adjusted to match those from the TRMM TMI. This was based on multiple years of rainfall estimates matched in space in time. The spatial and temporal matching is necessary to avoid eliminating differences resulting from diurnal variability. While the TMI samples throughout the day, the sun-synchrounous DMSP satellites sample at the same local times each day. As a result, the adjusted SSM/I rain rates will not exactly match those from TMI and they can change significantly over time as a result of satellite orbit drift.
Input Brightness Temperature Data:
The rainfall products provided here are computed from the Level 1C brightness temperature dataset.Data Availability:
Rainfall estimates are currently available from all the SSM/I
sensors, with the exception of F10, from January 1997 through the
present. This includes the following. Note that we hope to
eventually obtain and process data prior to 1997, however, this
will depend on the availability of the SSM/I TDR data from NOAA
and funding for this project.
F11 -> January 1, 1997 – May 15, 2005
F13 -> January 1, 1997 – Present
F14 -> May 8, 1997 – Present
F15 -> February 23, 2000 – Present
Rainfall Data:
Gridded daily and monthly rainfall maps have been produced for
the period specified above. These data are stored as byte values
in a binary data format to minimize storage/data transfer
requirements and avoid byte swapping issues between different
computer systems.
FTP Rainfall Data
Daily Gridded Rainfall Files Format
Monthly Gridded Rainfall Files Format
Rainfall Images:
Browse images in png format have been created for both the daily
and monthly gridded rainfall data products.
Create Daily Rainfall Images
Create Monthly Rainfall Images
FTP Pre-rendered Rainfall Images
Software:
Software to read the binary data files is available in both C and
IDL.
Get software
Additional Documentation/References:
| – | Hollinger, J., R. Lo, and G. Poe, Special Sensor Microwave/Imager User's Guide, Naval Research Laboratory, Washington, D.C., Sep. 14, 1987. |
| – | Hollinger, J. DMSP Special Sensor Microwave/Imager Calibration/Validation, Naval Research Laboratory, Washington, D.C., Vol 1, July 20, 1989. |
| – | Hollinger, J. DMSP Special Sensor Microwave/Imager Calibration/Validation, Naval Research Laboratory, Washington, D.C., Vol 2, May 20, 1991. |
| – | Kummerow, C., Y. Hong, W. S. Olson, S. Yang, R. F. Adler, J. McCollum, R. Ferraro, G. Petty, D. B. Shin, and T. T. Wilheit, 2001: The evolution of the Goddard profiling algorithm (GPROF) for rainfall estimation from passive microwave sensors, J. Appl. Meteor., 40, 1801-1820. |
Related Links:
National Geophysical Data Center
Remote Sensing Systems
NOAA Comprehensive Large Array-data Stewardship System (CLASS)